ROI Properties and Settings
Each region of interest that is created or imported appears on a separate line in the top section of the Data Properties and Settings panel. You can control the visibility of a region of interest within a scene with the icons available in the top section of the panel, extract information about the selected region of interest, as well as access opacity settings and tools in the lower section. A pop-up is also available that provides access to additional tools for processing regions of interest (see ROI Pop-Up Menu).
ROI properties and settings

A. List of ROIs B. Basic properties C. Statistical properties D. 2D opacity E. 3D opacity F. Tools G. 2D settings H. Visual effects I. Clip
All regions of interest that are available are listed in the top section of the Data Properties and Settings panel.
- Click the Regions of Interest
 icon at the top of the Data Properties and Settings panel to see the available ROIs (see Filters for information about filtering the listed items).
 - Click the Eye
 icon on the left side of a listed item to show or hide the region of interest in the currently selected scene. Click the 3D icon to show or hide the ROI in a 3D view. See Object List for more information about changing the visibility of an ROI, as well as renaming and copying ROIs
 - Select a region of interest to view basic information about the ROI and its statistical properties (see Basic Properties and Statistical Properties) and access settings to modify its appearance in 2D and 3D views (see 2D Opacity, 3D Opacity, 2D Settings, Visual Effects , and Clip). The Tools panel provides additional options to further analyze a region of interest (see Tools).
- Right-click the required region of interest to access functions for analyzing objects in an ROI, calculating connected porosity, or creating ROI templates (see ROI Pop-Up Menu).
The arrangement of objects in the Data Properties and Settings list determines the order of visibility in a view. Objects at the top of the list, such as regions of interest, are displayed over like objects that are lower down (see Object List for more information).
The information available for a selected region of interest includes its geometry, size, and volume.
|
|
Description |
|---|---|
|
Width |
Indicates the total number of pixels along the X-axis and its physical dimension*. |
|
Height |
Indicates the total number of pixels along the Y-axis and its physical dimension*. |
|
Depth |
Indicates the total number of pixels along the Z-axis and its physical dimension*. |
|
Time steps |
Indicates the size of the time (T) dimension. |
|
Total voxels |
Indicates the total number of voxels in the region of interest. Calculated as width*height*depth*time steps. |
| Volume (total voxels) | Indicates the total volume occupied by the region of interest. Calculated as voxels*pixel size cubed. |
* Calculated as pixels*spacing.
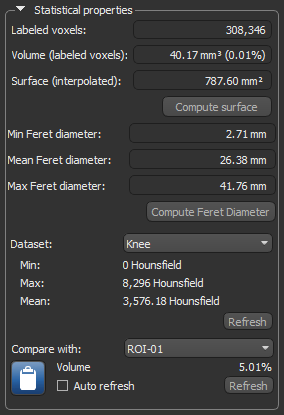
The information available for a selected region of interest includes the volume of all labeled voxels within the ROI, as well as the percentage of that volume within the shape that defines the geometry of the ROI. Other statistics include the minimum, maximum, and mean values of the labeled voxels that correspond to a selected dataset. You can also compare the volume of a selected region of interest with another ROI.
Statistical properties for regions of interest
| Description | |
|---|---|
|
Labeled voxels |
Indicates the total number of voxels that are labeled within the ROI. |
|
Volume (labeled voxels) |
Is the volume of all labeled voxels in the selected region of interest. Percentage volume… Is the comparative percentage of the volume of labeled voxels (all values that fall within the histogram) and the total number of voxels within the selected region of interest. The total number of voxels is calculated from the shape of the region of interest, and includes both labeled and unlabeled voxels. |
|
Surface (interpolated) |
Is the surface area of the labeled voxels in the selected region of interest, calculated with the Fast Marching method. Click the Compute Surface button to compute the interpolated surface. |
|
Feret diameters |
Provides measures of the labeled voxels of the selected region of interest in an arbitrary direction. Min Feret diameter… Indicates the shortest distance between any two points along the boundary of the labeled voxels at an arbitrary angle, also known as minimum caliper diameter. Max Feret diameter… Indicates the longest distance between any two points along the boundary of the labeled voxels at an arbitrary angle, also known as maximum caliper diameter. Mean Feret diameter… Indicates the mean value of the Feret diameters over a sufficient number of orientations. In Dragonfly, measurements for the mean Feret diameter are taken every 5 degrees. Click the Compute Feret Diameter button to compute the Feret diameters of the selected region of interest. |
|
Dataset |
Allows you to extract statistics for the selected dataset. Values are calculated for the labeled voxels within the ROI that correspond with the image data. Min… Indicates the minimum intensity value and is expressed in the native units of the dataset. Max… Indicates the maximum intensity value and is expressed in the native units of the dataset. Mean… Indicates the mean value and is expressed in the native units of the dataset. Click the Refresh button to update the statistics in the Information box if the selected region of interest is altered. |
|
Comparative volume |
Allows you to compare the volume of a selected ROI with another ROI. If Auto refresh is selected, information will be updated automatically whenever the selected region of interest is altered. If this option is not selected, you can click the Refresh button to update the statistics in the Information box. |
|
|
Click the Copy to Clipboard button to copy the ROI statistical properties to your clipboard, which can then be pasted into another application. |
Tools to create histograms of regions of interest are available in the Tools box (see Region of Interest Histograms).
Tools
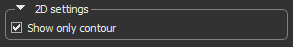
The options in the 2D settings box, shown below, let you change the appearance of ROIs in the 2D views of the current scene.
If the Show only contour item is checked, the highlight applied to the selected ROI will only appear along the contour of the region of interest.
2D settings
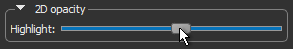
Use the Highlight slider, shown below, to adjust the opacity of the colored highlight applied to labeled voxels in 2D views.
2D opacity
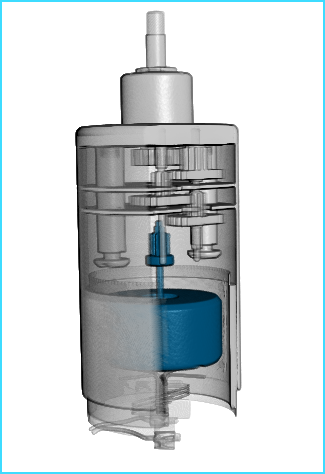
The sliders in the 3D Opacity box control how segmented images appear in 3D views. You can change the highlight applied to a region of interest, extract regions of interest so that only the ROIs are visible, or you can subtract regions of interest so that everything except the regions of interest is visible.
|
|
|
|
|
|
|
ROI highlighted in clipped rendering. |
|
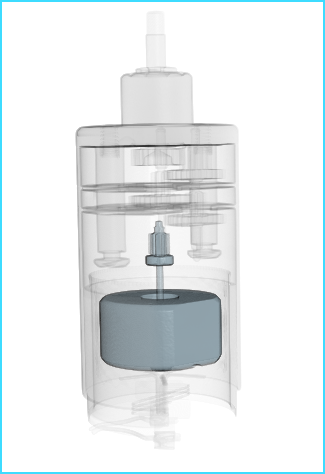
ROI extracted by increasing the ROI opacity and decreasing the opacity of the dataset. |
|
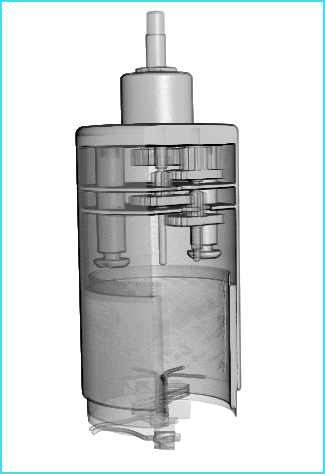
ROI subtracted by setting the ROI opacity to 0 and Dataset opacity to 100%. |
You must make sure that the selected region of interest is visible in both the scene (Eye icon) and in the 3D view (3D icon) to control its opacity. The appearance of a region of interest, or multiple ROIs, can also be adjusted in the Opacity Settings dialog (see Opacity Settings).
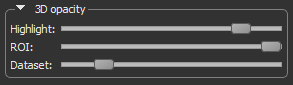
3D opacity
| Description | |
|---|---|
|
Highlight |
Adjusts the opacity of the colored highlight applied to the selected region of interest. At a value of 100%, the highlight will be fully opaque. At a value of 0%, the highlight will be transparent. |
| ROI | Adjusts the opacity of all image data that is visible in the view and that corresponds to the labeled voxels in the region of interest. |
| Dataset |
Adjusts the opacity of all image data that is visible in the view and that does not correspond to the labeled voxels in the region of interest. NOTE Controls for adjusting the opacity of each dataset are available in the Opacity Settings dialog (see Opacity Settings). |
The options in the Visual effects box, shown below, let you apply a selected visual effect or a combination of visual effects to the 3D view of a region of interest.
Visual effects
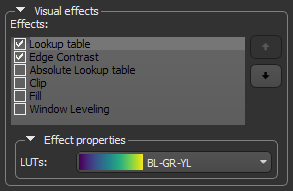
The properties of the visual effects that can be applied to a region of interest are described in the following table.
| Example | Description | |
|---|---|---|
|
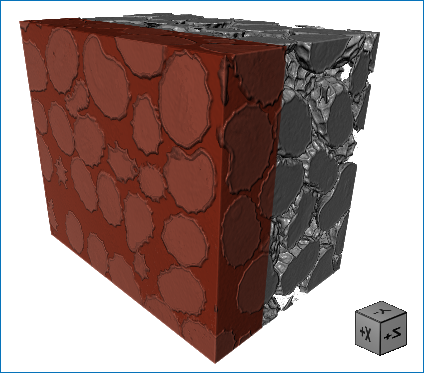
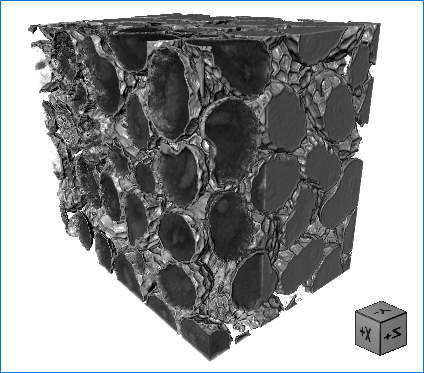
Original ROI |
|
Included for reference purposes. This is the original appearance of the region of interest, with a highlight applied.
|
|
Clip |
|
If selected, all data that corresponds to the region of interest will be clipped. |
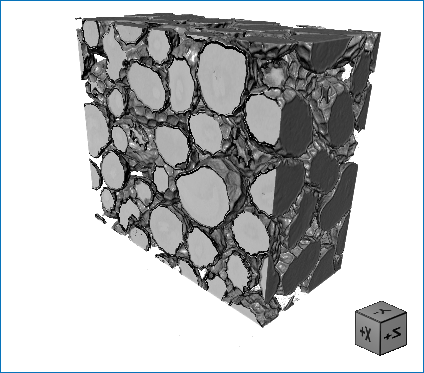
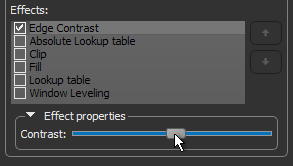
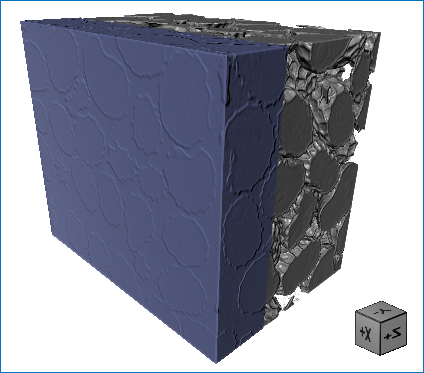
| Edge Contrast |
|
If selected, the intensity values of image data that correspond to the region of interest will be modulated with the values of their gradient modulus to produce an image in which edges are emphasized and other features are semi-transparent. The degree of contrast can be adjusted with the Contrast slider, as shown below.
|
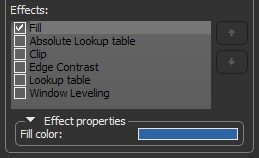
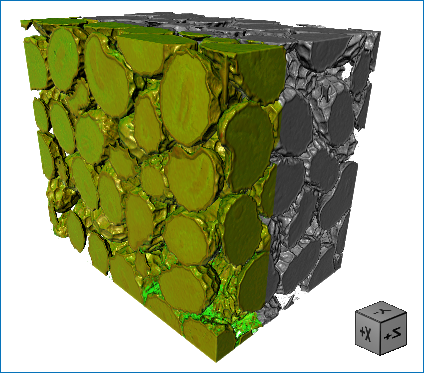
| Fill |
|
If selected, voxels that correspond to the region of interest be filled with a solid color. To select a fill color, click the color swatch and then choose a color in the Color dialog.
|
|
Look-Up Table and Absolute Look-Up Table |
|
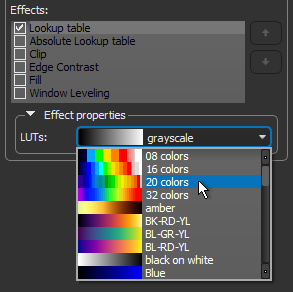
If selected, a look-up table (LUT) or an absolute look-up table function will be applied to image data that corresponds to the region of interest. LUT functions determine how regions within specific arrays of intensity are highlighted and how color is applied (see Using the LUT Editor). Look-up tables can be selected in the drop-down menu, as shown below.
NOTE If you choose an absolute LUT, color mapping will be applied independently of window leveling. This means that the colors mapped to specific values will be retained whenever leveling values are changed. For regular LUT functions, colors will be remapped to the range of values defined by the window width. |
|
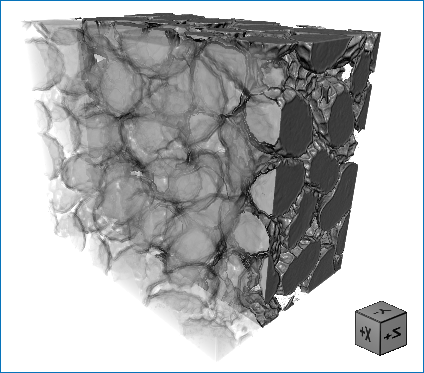
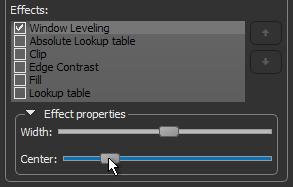
Window Leveling |
|
If selected, new window level values can be applied to image data that corresponds to the region of interest. The width of the window, as well as its center value, can be selected with the Width and Center sliders, as shown below.
|
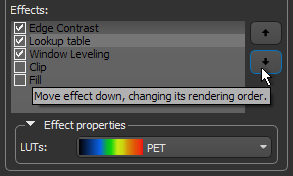
In some cases, you may find it advantageous to apply multiple effects to a visual or visuals. For example, edge contrast, window leveling, and a look-up table. You should note that when rendering a visual, Dragonfly will apply the selected effects in the order in which they appear in the Effects panel. If required, you can reorder selected effects with the Up and Down buttons on the right side of the panel, as shown below. Reordering effects will have an impact on the final look of the visual by either subtly or dramatically changing its appearance.
Reordering effects
You may need to adjust an effect property after reordering selected effects.
The Clip tool allows you to clip interactively along orthogonal planes in 3D views of the selected region of interest, as well apply visual effects to the clipped region (see Clipping and Other Visual Effects). You can also use the Clip tool to crop a region of interest (see Cropping Datasets).
Clip box
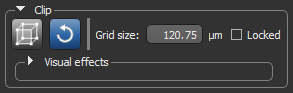
You can add and remove clipped regions from regions of interest (see How to Add and Remove Clipped Regions).