Selecting Statistical Properties for Analysis
You can choose the statistical properties you want to work with in the Statistical Properties dialog.
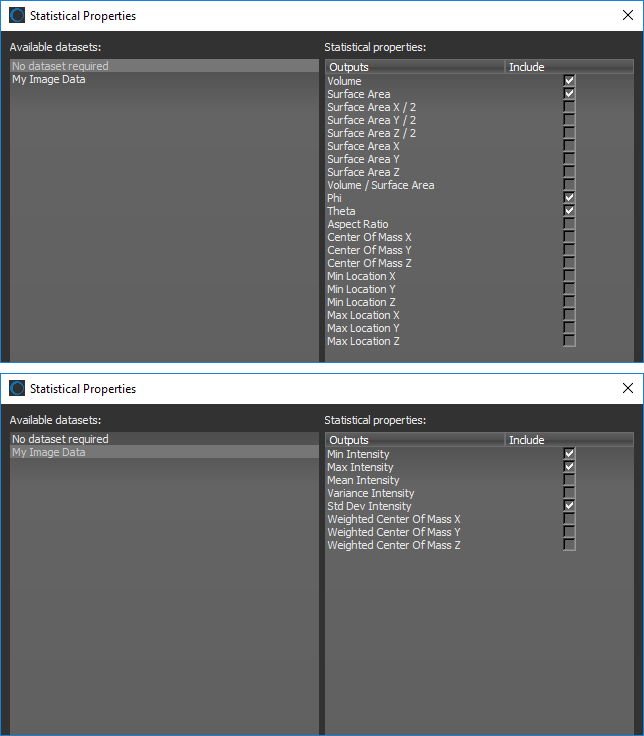
Click the Settings button at the top of the Object Analysis dialog to open the Statistical Properties dialog, shown below. You should note that some properties are available without a dataset, while others require a dataset.
Column Selector dialog
You can generate your own statistical properties for analyzing objects with the Object Analysis Statistics Generator (see Generating Object Analysis Statistics). You can also browse for and download additional statistical properties in the Infinite Toolbox (see Infinite Toolbox).
Datasets are not required to compute properties such as volume, surface area, Phi and Theta angles, aspect ratio, or the centers of mass of the objects within a multi-ROI.
| Description | |
|---|---|
|
Volume |
Is the volume occupied by a labeled object, that is, the amount of space inside of the object. For example, a cell. |
|
Surface Area |
Is the surface area of a labeled object, that is, it refers to the outside area of the object. |
|
Surface Area X/2 |
Is calculated as half of the area of the part of the surface that lies on the X axis. |
|
Surface Area Y/2 |
Is calculated as half of the area of the part of the surface that lies on the Y axis. |
|
Surface Area Z/2 |
Is calculated as half of the area of the part of the surface that lies on the Z axis. |
|
Surface Area X |
Is the area of the part of the surface that lies on the X axis. |
|
Surface Area Y |
Is the area of the part of the surface that lies on the Y axis. |
|
Surface Area Z |
Is the area of the part of the surface that lies on the Z axis. |
|
Volume/Surface Area ratio |
Is the calculated volume-to-surface area ratio. |
|
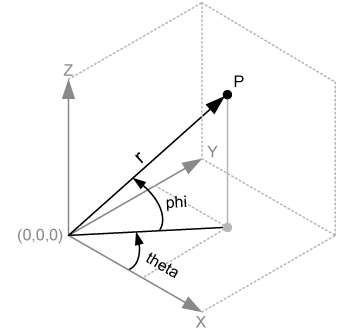
Phi and Theta angles |
As indicated below, the Theta angle is equal to the rotation of the X-axis towards the Y-axis. The Phi angle is equal to the rotation of the X-Y plane towards the Z-axis.
Anisotropic versus isotropic orientations can be used to determine if a material has undergone a change. For example, from a random distribution of grains to grains along a particular orientation. |
|
Aspect Ratio |
Describes the proportional relationship between the smallest Eigen value and the largest one for the inertia Eigen vectors. |
|
Center of Mass Xa, b, c |
Indicates the X-coordinate of the center of mass, which is calculated from the centroid of the object. |
|
Center of Mass Ya, b, c |
Indicates the Y-coordinate of the center of mass, which is calculated from the centroid of the object. |
|
Center of Mass Za, b, c |
Indicates the Z-coordinate of the center of mass, which is calculated from the centroid of the object. |
|
Min Location Xc |
Indicates the minimum X-coordinate of an object. |
|
Min Location Yc |
Indicates the minimum Y-coordinate of an object. |
|
Min Location Zc |
Indicates the minimum Z-coordinate of an object. |
|
Max Location Xc |
Indicates the maximum X-coordinate of an object. |
|
Max Location Yc |
Indicates the maximum Y-coordinate of an object. |
|
Max Location Zc |
Indicates the maximum Z-coordinate of an object. |
a Weighted center of mass measurements are also available when a dataset is selected (see Statistical Properties Available with a Dataset).
b The center of mass may be located outside the physical object, as is the case for hollow or open-shaped objects.
c In Dragonfly, X-Y-Z locations are described in the world coordinate system.
Datasets are needed to compute properties such as the minimum and maximum intensity values within an object and the weighted center of mass of an object. These statistics can also be calculated for multiple datasets.
| Description | |
|---|---|
|
Min Intensity |
Indicates the minimum voxel value found for each object in the multi-ROI. |
|
Max Intensity |
Indicates the maximum voxel value found for each object in the multi-ROI. |
|
Mean Intensity |
Indicates the mean value of all voxels found for each object in the multi-ROI. |
|
Variance Intensity |
Indicates the variance of all voxel values found for each object in the multi-ROI. |
|
Std Dev Intensity |
Indicates the standard deviation of all voxel values found for each object in the multi-ROI. |
|
Weighted Center of Mass Xa, b |
Indicates the X-coordinate of the weighted center of mass. |
|
Weighted Center of Mass Ya, b |
Indicates the Y-coordinate of the weighted center of mass. |
|
Weighted Center of Mass Za, b |
Indicates the Z-coordinate of the weighted center of mass. |
a The center of mass of a distribution of mass in space is the unique point where the weighted relative position of the distributed mass sums to zero. If the object has uniform density, it will be located at the centroid. If not, the weighted position coordinates of the distributed mass defines its coordinates.
b In Dragonfly, X-Y-Z locations are described in the world coordinate system.
The statistical properties for an analysis — with or without a dataset — can be selected in the Statistical Properties dialog.
- Click the Settings
 button at the top of the Object Analysis dialog.
The Statistical Properties dialog appears onscreen.
- Do the following, as required:
- Select "No dataset required" in the Available datasets box and then select the attributes you want to be included in your analysis in the Statistical properties box (see Statistical Properties Available Without a Dataset).
- Select the required dataset in the Available datasets box and then select the attributes you want to be included in your analysis in the Statistical properties box (see Statistical Properties Available with a Dataset).
NOTE Click the Refresh button to update the list of available datasets if you added new data to the Data Properties and Settings panel while the dialog was open.
- Do one of the following:
- Click the Apply button to add and compute the selected attributes.
- Click the OK button to add and compute the selected attributes and close the dialog.