Evaluating Segmentations
You can use the Segmentation Comparator to compare an automated segmentation with a ground truth and objectively evaluate the results with a number of metrics, such as Accuracy, Dice, True Positive Rate, True Negative Rate, and others. Results can be exported in the comma-separated values (*.csv extension) file format for further analysis or archiving.
Select the ROIs or multi-ROIs that you want to compare and then choose Open Segmentation Comparator in the pop-up menu to open the dialog shown below.
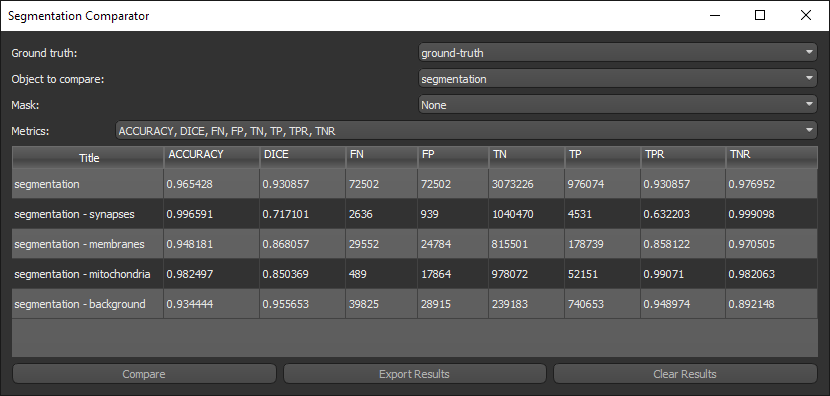
Segmentation Comparator dialog
The following metrics are available for objectively evaluating segmentations:
| Description | |
|---|---|
| Accuracy |
Is the fraction of pixels that were classified correctly and is calculated in terms of positives and negatives as:
|
| DICE | Is a measure of a models accuracy and calculated from precision and recall, where precision is the number of true positive results divided by the number of all positive results, including those not identified correctly, and recall is the number of true positive results divided by the number of all samples that should have been identified as positive. Precision is also known as positive predictive value, and recall is also known as sensitivity in binary classification. |
| FN | False negative, an outcome for which the model incorrectly predicted the negative class. |
| FP | False positive, an outcome for which the model incorrectly predicted the positive class. |
| TN | True negative, an outcome for which the model correctly predicted the negative class. |
| TP | True positive, an outcome for which the model correctly predicted the positive class. |
| TPR | Is the true positive rate. |
| TNR | Is the true negative rate. |
- Do one of the following:
- Choose Utilities > Structured Grids Comparator on the menu bar.
- Select the two regions of interest or multi-ROIs that you need to evaluate in the Data Properties and Settings panel, right-click, and then choose Open Segmentation Comparator in the pop-up menu.
Note The selected regions of interest or multi-ROIs must have the same geometry for comparison purposes.
- Choose the ground truth region of interest or multi-ROI in the Ground Truth drop-down menu.
- Choose the region(s) of interest or multi-ROI(s) you want to evaluate in the Object to Compare drop-down menu.
- Choose a mask in the Mask drop-down menu, optional.
- Select the required metrics in the Metrics drop-down menu.
- Click Compare.
The results of the comparison appear in the dialog.
- Click Export Results to export the comparison in the comma-separated values (*.csv extension) file format.
- Evaluate other regions of interest or multi-ROIs, if required.
Note You can clear the current results or accumulate a series of results.
