Using the Points Tool
The Points annotation tool lets you add a series of points to the 2D views or 3D view in a scene. A points set can include any number of points
Points set

In addition, a number of functions are available for points sets, such as aligning views, creating rulers, and fitting cylinders and spheres (see Annotation Pop-Up Menu).
- Click the Points
 tool in the Annotate panel.
 - Hold down Left Ctrl and then click on the image to add the first point in the set.
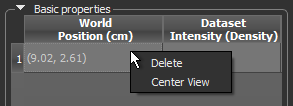
The coordinates of the point and its native value appear in the Basic properties box on the Data Properties and Settings panel. If required, you can add a caption to the point.
- Add additional points, as required.
- Do the following to reposition points, if required:
- Select the required point(s), either directly in a view or in the Basic properties table.
- Click inside a selected point and then drag to reposition the point(s).
You can customize the appearance of points and their captions in the Properties box, shown below.
Points properties

| Description | |
|---|---|
| Thickness |
Indicates the thickness (in screen percentage) of the contour that defines the shape of the annotation.
|
| Show captions | If selected, captions will be shown with each point. The type of caption is selectable in the Basic properties box (see Basic Properties). |
| Font size and style | Lets you increase or decrease the font size of the caption with the Increase font size and Decease font size buttons, as well as choose a font style. |
| Control point size |
Lets you set the size (in screen percentage) of the annotation's control points.
|
| Control point appearance | Let you choose a shape — circle, square, triangle, cross, or 'X' — for the annotation's control points. |
The basic properties of each point in the set is available in the Basic properties table, shown below.
Basic properties

| Description | |
|---|---|
| World Position | Indicates the world position of each point. |
| Voxel Position | Indicates the voxel position of each point for all datasets visible in the scene. |
| Intensity | Indicates the native value of each point for all datasets visible in the scene. |
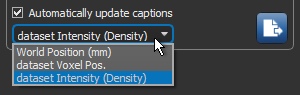
| Automatically update captions |
If checked, lets you choose the type of caption that will be displayed.
Note You can manually enter custom captions by double-clicking inside the cell that corresponds to the point that you want to label. |
|
|
Exports the world position of each point in the set in the CSV or JSON file format. JSON (JavaScript Object Notation) is a text format that is completely language independent, but uses conventions that are familiar to programmers of the C-family of languages, including C, C++, C#, Java, JavaScript, Python, and many others.
Note The length units of Points annotation data (Scout and Zoom tags) that are exported in the JSON file format are automatically encoded in micrometers with a precision of two decimal points. This will be applied regardless of the Preferences settings for the default unit or significant digits for measurements. In this scheme, a measurement of 5.2 mm will be exported as 5200.00 micrometers, 3.762834 mm as 3762.83 micrometers, and so on. You should also note that this export option is available for Dragonfly 3D World ZEISS edition only. |
A number of configured actions and keyboard shortcuts are available for creating and editing point sets. The default settings for these actions are listed in the following table.
| Action | Key | Mouse |
|---|---|---|
| Create a point in Point mode | Left Ctrl | Left mouse |
| Edit a point in Point mode | - | Left mouse |
| Switch to Point mode | - | - |
