Statistical Properties
You can choose the statistical properties that you want to work with in the Statistical Properties dialog.
Click the Settings button at the top of the Object Analysis dialog to open the Statistical Properties dialog, shown below. You should note that some properties are available without a dataset, while others require a dataset. You can also include scalar values previously calculated for the selected multi-ROI in your current analysis.
Statistical Properties dialog
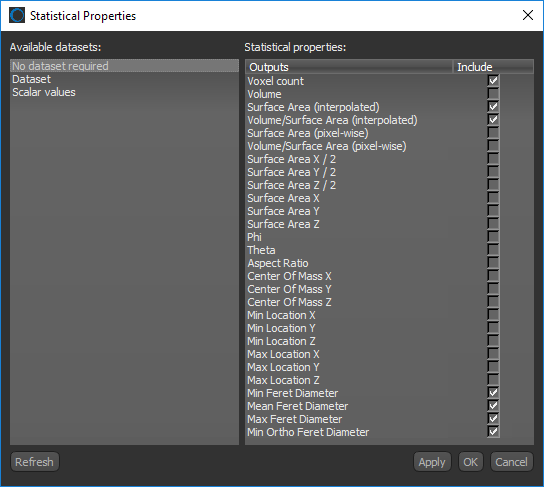
You can choose statistical properties that are related directly to the selected multi-ROI, that reference a selected dataset, or that were previously calculated in you current analysis.
Datasets are not required to compute properties such as volume, surface area, Phi and Theta angles, aspect ratio, or the centers of mass of the objects within a multi-ROI. To view the statistical properties available without a dataset, select the No dataset required option in the Statistical Properties dialog.
| Description | |
|---|---|
|
Voxel Count |
Is the total number of voxels in each labeled object, or connected component. |
|
Volume |
Is the volume occupied by each labeled object, that is, the amount of space inside of the object. For example, a cell. |
|
Surface Area (interpolated)a |
Is the surface area of each labeled object, that is, it refers to the outside area of the object. NOTE The interpolated surface area is usually a more robust measurement than the pixel-wise method. |
|
Volume/Surface Area (interpolated) |
Is the calculated volume-to-surface area ratio. |
|
Surface Area (pixel-wise) |
Is the surface area of each labeled object, that is, it refers to the outside area of the object. |
|
Volume/Surface Area (pixel-wise) |
Is the calculated volume-to-surface area ratio. |
|
Surface Area X/2 |
Is calculated as half of the area of the part of the surface that lies on the X axis. |
|
Surface Area Y/2 |
Is calculated as half of the area of the part of the surface that lies on the Y axis. |
|
Surface Area Z/2 |
Is calculated as half of the area of the part of the surface that lies on the Z axis. |
|
Surface Area X |
Is the area of the part of the surface that lies on the X axis. |
|
Surface Area Y |
Is the area of the part of the surface that lies on the Y axis. |
|
Surface Area Z |
Is the area of the part of the surface that lies on the Z axis. |
|
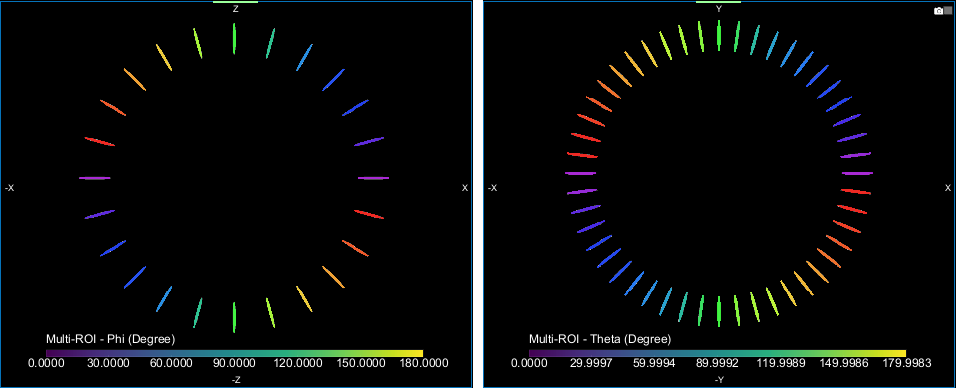
Phi and Theta angles |
In Object Analysis, Phi and Theta describe the orientation of the longest axis (shortest eigenvalue of the tensor of inertia) of an object in the local orientation system of the analyzed multi-ROI. The value of Phi is the angle from the X axis of the projection on the XZ plane of the orientation, while the value of Theta is the angle from the X axis of the projection on the XY plane of the orientation. Phi (left) and Theta (right) angles
NOTE These angles describe an orientation, not a vector. This is why the values are in the range of 0 to 180°. |
|
Aspect Ratio |
Describes the proportional relationship between the smallest eigenvalue and the largest for the inertia eigenvectors. The aspect ratio is computed as the ratio of the min(eigenvalue1, eigenvalue2, eigenvalue3)/max(eigenvalue1, eigenvalue2, eigenvalue3). You should note that a perfect cube or sphere would have an aspect ratio of 1.0, while a square or circle would have an aspect ratio of 0.5. The aspect ratio of a perfect rod of one voxel wide or a point is 0.0. |
|
Center of Mass Xb, c, d |
Indicates the X-coordinate of the center of mass, which is calculated from the centroid of the object. |
|
Center of Mass Yb, c, d |
Indicates the Y-coordinate of the center of mass, which is calculated from the centroid of the object. |
|
Center of Mass Zb, c, d |
Indicates the Z-coordinate of the center of mass, which is calculated from the centroid of the object. |
|
Min Location Xd |
Indicates the minimum X-coordinate of an object. |
|
Min Location Yd |
Indicates the minimum Y-coordinate of an object. |
|
Min Location Zd |
Indicates the minimum Z-coordinate of an object. |
|
Max Location Xd |
Indicates the maximum X-coordinate of an object. |
|
Max Location Yd |
Indicates the maximum Y-coordinate of an object. |
|
Max Location Zd |
Indicates the maximum Z-coordinate of an object. |
|
Min Feret Diameter |
Is the shortest distance between any two points along each object's boundary at an arbitrary angle. Also known as the minimum caliper diameter. |
|
Mean Feret Diameter |
Is the mean value of the minimum and maximum Feret diameters of each object's boundary over a sufficient number of orientations. |
|
Max Feret Diameter |
Is the longest distance between any two points along each object's boundary at an arbitrary angle. Also known as the maximum caliper diameter. |
|
Min Ortho Feret Diameter |
Is the shortest distance between any two points along each object's boundary that are orthogonal to the object's maximum Feret diameter. |
|
Min Ortho/Max Feret Diameter |
Is the ratio of the minimum orthogonal Feret diameter to the maximum Feret diameter. This measure can provide a good indication of the elongation of a particle. |
a The interpolated surface area is calculated as per the method described in Lindblad, J. (2005). Surface area estimation of digitized 3D objects using weighted local configurations, Image and Vision Computing, 23(2), Pages 111-122.
b Weighted center of mass measurements are also available when a dataset is selected (see Statistical Properties with a Dataset).
c The center of mass may be located outside the physical object, as is the case for hollow or open-shaped objects.
d In Dragonfly, X-Y-Z locations are described in the world coordinate system.
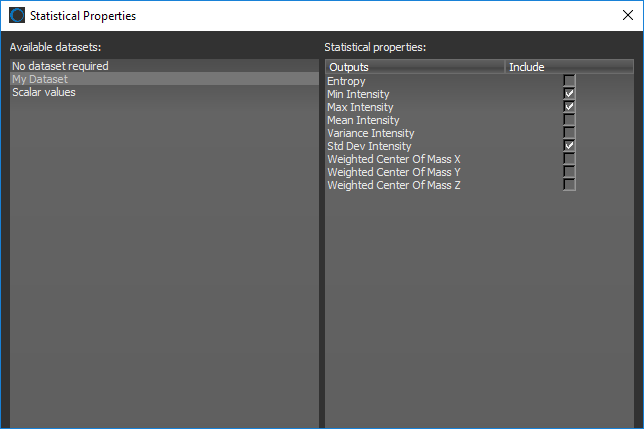
Datasets are needed to compute statistical properties such as the minimum and maximum intensity values within an object and the weighted center of mass of an object. To view the statistical properties available with a dataset or for multiple datasets, shown below, select the required dataset(s) in the Statistical Properties dialog.
Statistical Properties dialog
| Description | |
|---|---|
|
Entropy |
Entropy is a histogram-based descriptor that is a measure of information content based on the local histogram shape. In image processing entropy might be used to classify textures, a certain texture might have a certain entropy as certain patterns repeat themselves in approximately certain ways. A component with low entropy is more homogenous than a component with high entropy. Likewise, a vector with relatively "low" entropy is a vector with relatively low information content. A vector with relatively "high" entropy is a vector with relatively high information content. NOTE Refer to https://en.wikipedia.org/wiki/Entropy_(information_theory) for more information about entropy. |
|
Min Intensity |
Indicates the minimum voxel value found for each object in the multi-ROI. |
|
Max Intensity |
Indicates the maximum voxel value found for each object in the multi-ROI. |
|
Mean Intensity |
Indicates the mean value of all voxels found for each object in the multi-ROI. |
|
Variance Intensity |
Indicates the variance of all voxel values found for each object in the multi-ROI. |
|
Std Dev Intensity |
Indicates the standard deviation of all voxel values found for each object in the multi-ROI. |
|
Weighted Center of Mass Xa, b |
Indicates the X-coordinate of the weighted center of mass. |
|
Weighted Center of Mass Ya, b |
Indicates the Y-coordinate of the weighted center of mass. |
|
Weighted Center of Mass Za, b |
Indicates the Z-coordinate of the weighted center of mass. |
a The center of mass of a distribution of mass in space is the unique point where the weighted relative position of the distributed mass sums to zero. If the object has uniform density, it will be located at the centroid. If not, the weighted position coordinates of the distributed mass defines its coordinates.
b In Dragonfly, X-Y-Z locations are described in the world coordinate system.
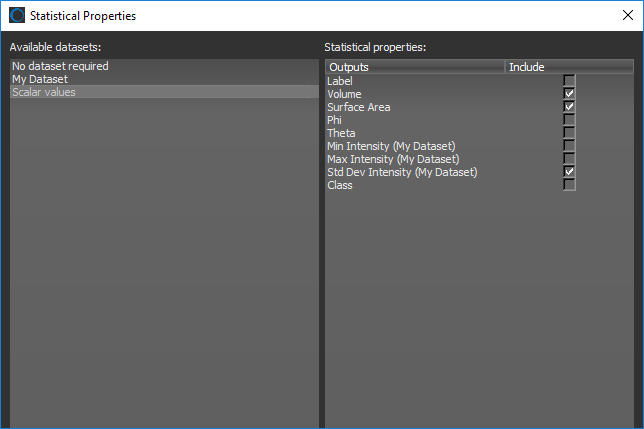
If required, you can include the scalar values that were previously calculated for the selected multi-ROI in your current analysis. To view the scalar values available for the selected multi-ROI, select the Scalar values option in the Statistical Properties dialog.
Statistical Properties dialog
The statistical properties for an analysis — with or without a dataset — can be selected in the Statistical Properties dialog. You can also include scalar values previously calculated for the selected multi-ROI.
- Click the Settings
 button at the top of the Object Analysis dialog.
 The Statistical Properties dialog appears onscreen.
- Do the following, as required:
- Select No dataset required in the Available datasets box and then select the attributes you want to be included in your analysis in the Statistical properties box (see Statistical Properties No Dataset Required).
- Select the required dataset(s) in the Available datasets box and then select the attributes you want to be included in your analysis in the Statistical properties box (see Statistical Properties with a Dataset).
NOTE Click the Refresh button to update the list of available datasets if you added new data to the Data Properties and Settings panel while the dialog was open.
- Select Scalar values in the Available datasets box and then select the statistical properties previously calculated for the multi-ROI that you want to be included in your current analysis.
- Do one of the following:
- Click the Apply button to add and/or compute the selected attributes.
- Click the OK button to add and/or compute the selected attributes and close the dialog.