Profiling Intensity
Use the Intensity Profile function to profile the intensity values of image data along the length of a ruler or path. In Advanced Mode, you can also plot multiple profiles from selected datasets.
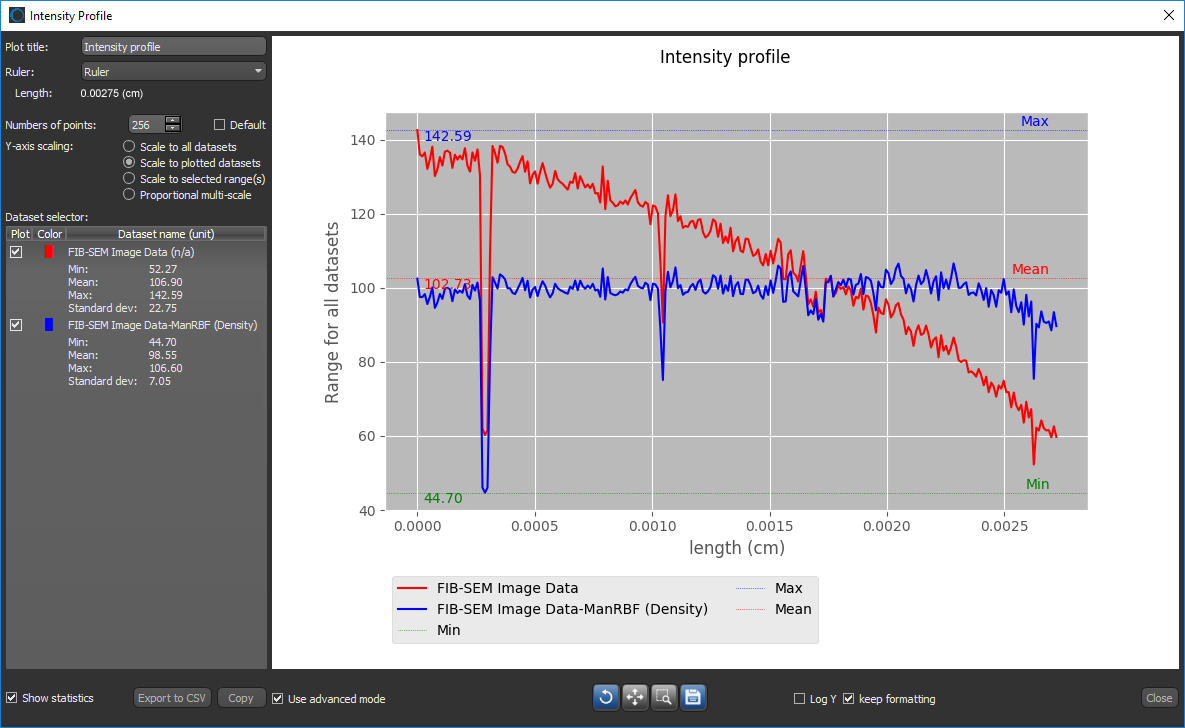
Select a ruler or path in the Data Properties and Settings panel and then click the Profile button in the Tools box to open the Intensity Profile dialog, shown below.
Intensity Profile dialog
| Description | |
|---|---|
|
Annotation |
Indicates the ruler or path from which the profile values will be plotted. You can select any available ruler or path in the drop-down menu. Length… Indicates the length of the selected ruler or path. |
|
Dataset* |
Lets you select the image data that will be used to plot the profile, when you are working in Standard mode. |
|
Number of points |
Lets you set the number of points that will be sampled when the profile is plotted. Reset… Resets the number of points that will be sampled to maximum possible for the selected annotation and dataset(s), based on length and image spacing. |
|
Averaging mode |
Lets you average the probed intensity values within a disk or square perpendicular to the selected annotation. The diameter of disk or square can be set in the Diameter edit box. Point… Averaging will not be done. Disk… Averaging will done with a disk of a set diameter. Square… Averaging will done within a square of a set diameter |
|
Plot tile |
Indicates the title that appears above the profile. NOTE You can enter a new title for the profile in the Plot title edit box, if required. |
|
Dataset selector |
TBD ADD IMAGE HERE? |
|
Statistics*** |
Describes the plotted values as follows: Minimum… Indicates the minimum value(s) within the selected dataset(s), as computed for the selected Averaging mode. Maximum… Indicates the maximum value(s) within the selected dataset(s), as computed for the selected Averaging mode. Mean… Indicates the mean value(s) within the selected dataset(s), as computed for the selected Averaging mode. Standard deviation… Indicates the standard deviation(s) of plotted values. |
|
Y-axis scaling** |
Lets you choose how Y-axis scaling will be applied when multiple datasets are plotted. Scale to plotted datasets… If selected, the Y-axis will be scaled to the plotted datasets. Scale to selected range(s)… If selected, the Y-axis will be scaled to the maximum of the datasets selected in the Range column. Proportional multi-scale… If selected, the profiles will scaled proportionally. Use this feature to compare the shapes of multiple profiles plotted from datasets saved in different data types. |
|
Extra lines |
Lets you add additional information to the graph. None… No additional information will appear on the graph. Global minimum, mean, and maximum… The minimum, mean, and maximum values, as computed for the selected Averaging mode and all plotted datasets, will be added to the graph. Individual minimum and maximum… The original minimum and maximum values will appear on the graph as a series of dotted lines in additional to the averaged values for each plotted dataset. |
|
Advanced mode |
If checked, the options for working in Advanced mode will be available (see Working in Advanced Mode). |
|
Export to CSV |
Lets you export profile data in the comma-separated values file format (*.csv extension) . |
|
Copy to clipboard |
Copies the profile statistics to the clipboard. |
|
Log Y |
If checked, the Y-axis of the histogram will be plotted in Log scale. |
|
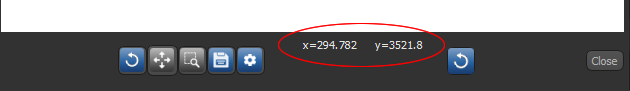
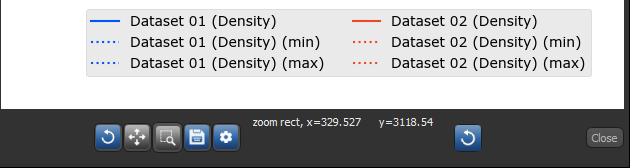
Tools |
Allows you to zoom, pan, and reset the intensity profile. You can also save the figure as a bitmap image, scalable vector graphic, or as raw data. See Using the Profile Tools for more information. Coordinates… The X-Y coordinates of the cursor position on the profile are indicated on the Tools panel, as shown below.
|
* Available when working in Standard mode only.
** Available when working in Advanced mode only.
*** Values are calculated for the selected image data(s) and expressed in the native units of the dataset(s).
Whenever you plot an intensity profile, you can choose to work in Standard mode, in which case the plot of a single dataset will be available, or you can choose to work in Advanced mode, in which case you can plot the profiles of multiple datasets.
- Select the required ruler or path in top section of the Data Properties and Settings panel.
- Click the Profile
 button in the Tools box.
By default, the profile appears in the last-accessed mode. See Working in Standard Mode for information about working in this mode. For information about plotting and comparing multiple profiles, see Working in Advanced Mode.
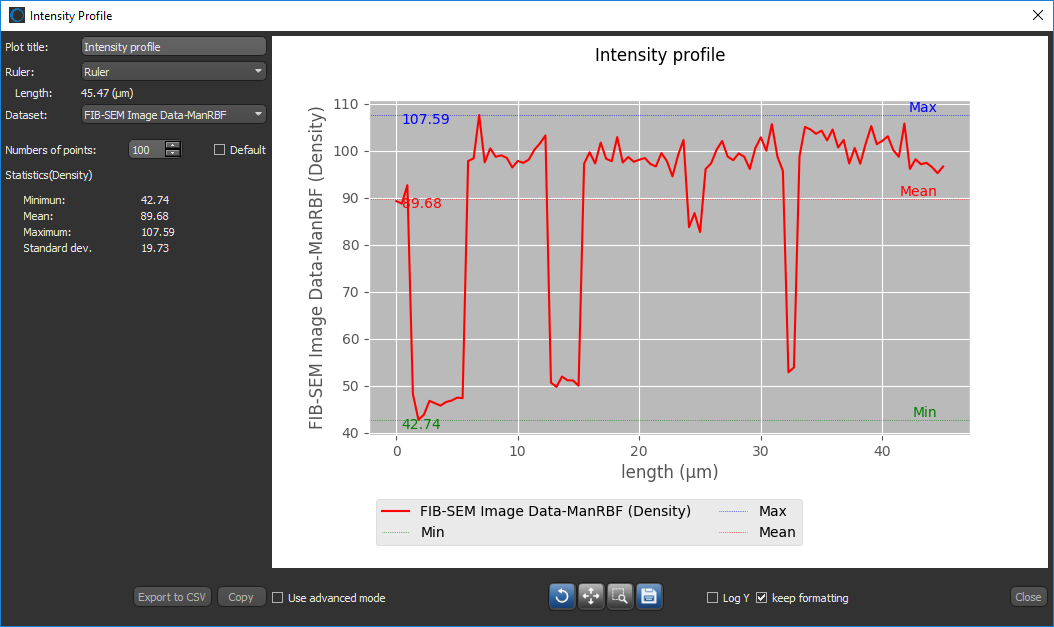
In Standard mode, you can profile the intensity values of a ruler or path on a selected dataset.
Intensity profile in Standard mode
- Make sure that Advanced mode is not checked. This option is available at the bottom left of the dialog.
- Select the ruler or path you need to profile in the Annotation drop-down list, if required.
- Select the dataset for which you want to extract the profile in the Dataset drop-down list, if required.
- Change the number of points to be sampled, optional.
NOTE You change the number of points by entering a new value in the edit box or by clicking the Increase or Decrease buttons. You can also click the Reset button to set the number of points to maximum possible for the selected annotation and dataset, based on length and image spacing.
- Choose an Averaging mode — Point, Disk, or Square — in the drop-down menu, as required.
If you are averaging values within a disk or square, enter the required diameter in the Diameter edit box.
- Enter a new title for the profile in the Plot title edit box, optional.
- Examine the profile of the selected dataset and related statistics.
If required, you can add information to the profile — including the global minimum, mean, and maximum values or the individual minimum and maximum values to averaged profiles — with the Extra lines options.
- Adjust the view of the profile with the Pan and Zoom tools, as required.
See Using the Profile Tools for information about panning and zooming the graph.
- If required, you can adjust the range of the X and Y axes and their associated labels, as well as the color and style of all curves and markers.
See Using the Profile Tools for information about choosing the figure options.
- Save the profile data in a comma-separated values file, copy data to the clipboard, or create a bitmap image or scalable vector graphic of the histogram, optional.
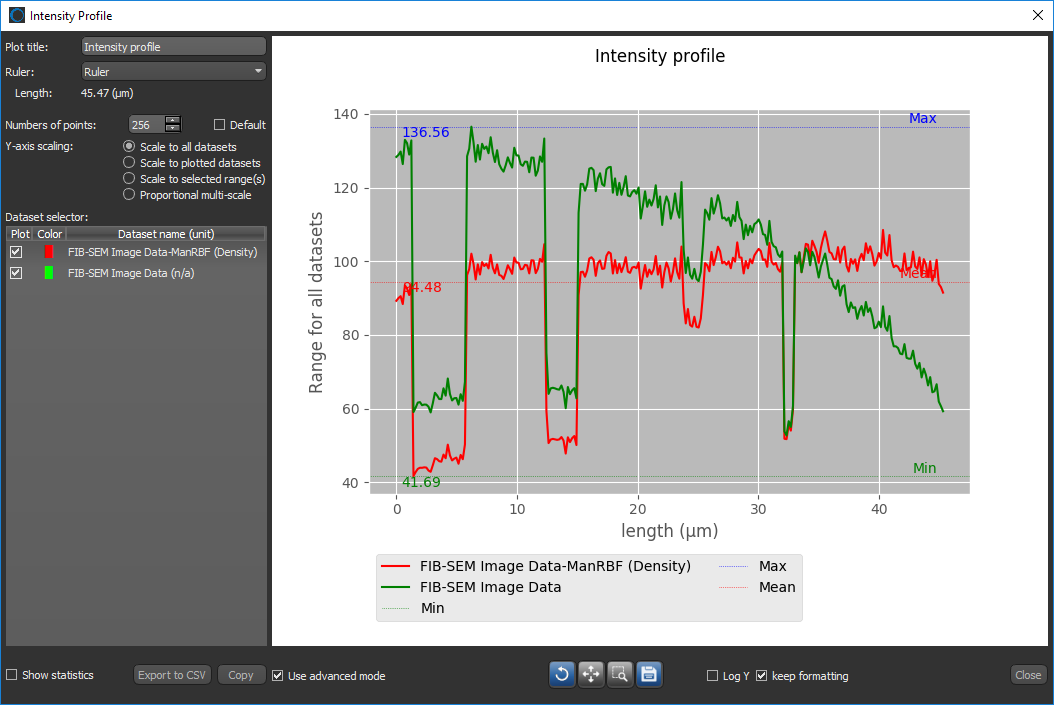
In Advanced mode, you can profile the intensity values of a selected ruler on multiple datasets.
Intensity Profile in Advanced mode
- Make sure that Use advanced mode is checked. This option is available at the bottom left of the dialog.
- Enter a new title for the profile in the Plot title edit box, optional.
- Select the ruler or path you need to profile in the drop-down list, if required.
- Change the number of points sampled that will be sampled, optional.
NOTE You change the number of points by entering a new value in the edit box or by clicking the Increase or Decrease buttons.
- Select the datasets you want to be plotted in the Dataset Selector box.
By default, the profiles of all datasets available in the Properties and Settings panel are plotted.
- Select the Y-axis scaling as follows:
Scale to all datasets… If selected, the Y-axis will be scaled to all datasets.
Scale to plotted datasets… If selected, the Y-axis will be scaled to the selected datasets.
Scale to SR datasets… If selected, the Y-axis will be scaled to the selected restricted (SR) datasets. You can select these datasets by checking the appropriate boxes in the SR column in the Dataset selector box.
Proportional multi-scale… If selected, the profiles will scaled proportionally. Use this feature to compare the shapes of multiple profiles.
- Select the Show statistics option, optional. If checked, the minimum, maximum, mean, and standard deviation for each plotted dataset will appear in the Dataset selector box.
- Examine the profile of the selected image data.
See Using the Profile Tools for information about panning and zooming the graph.
- Save the profile data or create a bitmap image or scalable vector graphic of the histogram, optional.
The Profile tools, shown below, allow you to pan and zoom profiles, as well as save profiles as bitmaps, vector graphics, or PDFs.
Profile tools
|
|
Icon | Description |
|---|---|---|
|
Reset |
|
Resets the original view of the figure. |
|
Pan |
|
Pans or zooms the figure as described below. Pan… Click with the left mouse button and then drag to pan the figure. Zoom on the Y axis… Click with the right mouse button and then drag up and down to Zoom in and Zoom out on the Y axis. Zoom on the X axis… Click with the right mouse button and then drag left and right to Zoom in and Zoom out on the X axis. |
|
Zoom |
|
Zooms to a selected rectangle, which can be defined by dragging your cursor over the area that you want to zoom. |
|
Save |
|
Saves the figure as a bitmap image, vector graphic, or in the PDF file format. The figure can also be saved as raw data or PGF code for LaTeX. Standard image files (*.jpeg, *.jpg, *.png, *.tif, *.tiff extensions)… Saves the figure as a bitmap image in the screen resolution. Postscript files (*.eps, *.ps extensions)… Saves the figure as an encapsulated postscript or postscript file. These types of files have a selectable resolution and provide high-quality graphics for publications. PGF code for LaTeX (.pgf extension)… Saves the figure in the Portable Graphics file format. Raw RGBA bitmap (*.raw, *.rgba extensions)… Saves the figure as a raw bitmap image file, in which the file contains only a list of pixel colors and nothing else. Scalable vector graphics (*.svg, *.svgz extensions)… Saves the figure in an XML-based vector image format. The SVG specification is an open standard developed by the World Wide Web Consortium (W3C). SVG images and their behaviors are defined in XML text files. Portable document format (*.pdf extension)… Saves the figure in the Adobe PDF file format. |
|
Edit |
|
TBD |
|
Reset |
|
Resets the figure options.
|